Petrochemical Industry Drivers and Outlook

Walter Sedriks, Principal, Sedriks & Associates
Contents
Highlights
Buyers and Sellers Markets
Ethylene Scenarios
Oil Prices
About the Author
Highlights(Back to Top)
A study updating Sedriks & Associates (S&A) projections on the underlying petrochemical profitability cycle indicates that the outlook for both cycle timing and amplitude is as uncertain as it has ever been, if not more so. This contrasts with a wealth of recently reported projections from which state with confidence that a major profitability upturn will take place in the period 2003-2005.
A prime contributor to the uncertainty in our projection framework relates to the extraordinary and continuing strength of the US economy. In the boundary region, small changes in either available capacity or in demand can result in substantial swings in prices, swings that influence player's perceptions, actions, and profitability outcomes.
In our assessment, at least two medium term scenarios along the lines outlined below, should be examined by prudent planners. Our analysis suggests that if, over the next five years, petrochemicals players were to moderate even marginally, their natural inclination to expand capacity, a significantly improved profitability picture could emerge.
Buyers and Sellers Markets(Back to Top)
Prices and profitability in the short and medium-term are determined by expectations about product shortages. A good first approximation for such expectations in unconstrained markets is industry capacity utilization (ICU). As might be expected for a basic product, subject to global competition, ethylene profitability turns out to be a strong (although not necessarily precise) function of ICU. This is shown in the "Hockey-Stick" profile in Figure A. Here, the CFROI (Cash Flow Return on Investment) for the marginal ethylene producers is plotted as a function of effective ICU on an annual basis.

Such hockey-stick profiles are widely applicable in medium-term pricing analysis and show that the situation can typically be viewed in the traditional terms of a "buyers" and a "sellers" market. They are somewhat analogous to the Phillips curves in classical economics, which quantify medium-term trade-offs between inflation and unemployment (manpower capacity usage). Below a critical point in ICU (in the region of 90% for US ethylene), prices are cost-related and tend toward the cash-cost level (zero margin) for the stragglers. However, as the critical point is passed, prices can and do fly up substantially, although often there are some lags in the system.
The mechanism for cycling in profitability is thus seen to be intimately related to the hockey-stick profiles. The cycling occurs as we move back and forth over the critical point.
Ethylene Scenarios(Back to Top)
Two scenarios that we developed for US ethylene price and margin outlook in the current study are illustrated in Figure 1.

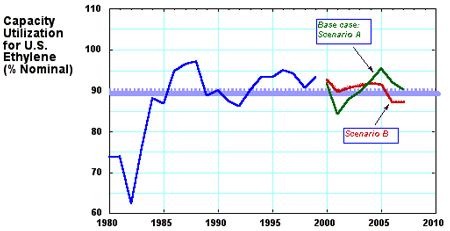
The corresponding US ethylene capacity utilization profiles are shown in Figure 2. Because ethylene is a good practical surrogate for petrochemicals and the United States still represents the global benchmark, the trends and cycle timing also represent a first approximation for the industry as a whole.

In terms of cycle timing, in our base case scenario (A) another sustained fly-up starts in 2003 and peaks over 2004-2005. This has consistently been our base case now for some 5 years.
Interestingly the timing projections for the petrochemical profitability cycle published by most other consultants have, in the past couple of years, come around to essentially this same cycle timing. Such a degree of consensus in forecasting is usually a warning sign for something radically different to happen.
Our current base-case does differ from our previous projections in that the exceptional strength of the US economy has served to pull up petrochemical demand to levels at which a moderate profitability spike is seen this year.
An alternative scenario (B), now gaining plausibility, would be one in which the extraordinary boom continues and keeps petrochemicals markets relatively tight, not only for this year, but for the next five. This despite the slew of new capacity slated to come online for ethylene and most other major products toward the end of this year and in 2001. Looking further forward, assuming an inherent long-term industry profitability cycle of the order of eight years, another sustained peak would be seen around 2012-13 in both scenarios.

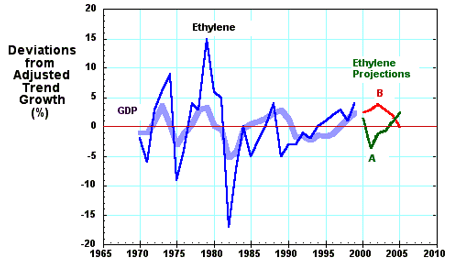
The assumptions about ethylene demand growth that respectively underpin the two scenarios are illustrated in Figure 3. The 1999 growth rate for the US was significantly above the trend we estimate for the longer term. The base-case A scenario requires demand to fall off rapidly over the next two years before turning back up in 2003, in a pattern that broadly mirrors the last major downturn. In practice this could be caused either by a slackening in the US economy or decrease in petrochemicals exports, or both.
In the alternative B scenario, ethylene growth stays well above trend till 2004. That would parallel a continuing boom of the overall economy, driven by the "new economy," with no substantial drop off in petrochemical exports.
In both of the scenarios the petrochemical industry as a whole matures, and ethylene trend growth over the next decade falls to levels below those of the past decade. Note that for medium-term projections, it is the deviations from trend growth that are more critical than the trend growth rate pre se.
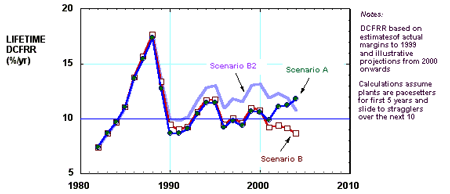
Interestingly, and somewhat paradoxically, the "boom" Scenario B as constructed here results in lower lifetime profitability for plants built over the next decade. This is because of lower peak height for the 2003-04 time frame, and the extreme sensitivity of lifetime profitability to peak amplitude and timing. The reason peaks are not as high in Scenario B is that the economy continues to be vibrant over the next few years, generating more capacity creep than in Scenario A. It then takes a dip towards 2005. The resulting capacity utilization pattern is shown in Figure 2. In Scenario A, by contrast, ethylene growth by 2005 is back above trend, less net capacity has been added in the interim, and the capacity utilization pattern is more favorable.
Note, however, that the projected capacity utilization in Scenario B hovers marginally above the critical point on the hockey stick. That represents a highly unstable situation with potential for very substantial volatility. Thus, for example, any unexpected outages could trigger shorter-term fly-ups. Further, if more moderate expansion takes place or growth is moderately higher, substantially improved prices and profitability would result. Thus quite modest changes in assumptions about the capacity or demand picture have a major effect on the profitability outcome for the growth profile underlying Scenario B.
The lifetime profitability picture corresponding to the projections is shown in Figure 4. In it we include a variation on Scenario B in which capacity creep is taken at a level that averages 1.2%/yr as opposed to 1.6%/yr in the original scenario. The net effect of this relatively modest difference is to push rates of return up by some 2% for plants started up after 1990! The illustration serves to emphasize the high level of uncertainty currently associated with projection of petrochemical prices and profitability. It also highlights the substantial impact that could result from moderation in capacity expansion.

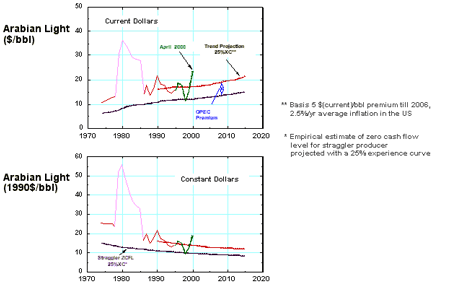
Note that the upward movement in price in 2000 (Figure 1) is driven equally by product tightness and by the relatively high level of oil prices. Our projections have Arabian Light at an average 2000 price of 21$/b (ca 24$/b for W. Texas Intermediate), based on a decline of Arabian Light to around $18/b before the end of the year. That implies a somewhat less coherent OPEC than assumed by the futures market.
Oil Prices(Back to Top)
The medium-term projections of oil price to which the present scenarios are keyed are shown in Figure 5. We also emphasize that the analysis here is, in essence, a longer-term one, and as such uses year average values for quantification. This can at times detract from the richness of the underlying texture. For example, in 1999 Saudi Light ranged from $8/bbl to $23/bbl, which corresponds to an inherent range of 6¢/lb ($130/t) in the price of ethylene.

About the Author(Back to Top)
 Walter Sedriks, Principal in Sedriks & Associates, has a broad chemical industry background. Formerly Director of Economic Studies for the Chemicals & Energy Practice at SRI International, Dr. Sedriks has recently founded Sedriks & Associates. He currently specializes in analysis of chemical industry trends and in projection of petrochemical prices and profitability. In his 20 years at SRI, he led and participated in a wide variety of projects and programs serving clients in the industry. He was instrumental in developing key methodologies for price and margin projection and for cost analysis, and in utilizing these in feasibility and benchmarking studies, in asset valuations and in transfer pricing models for major petrochemical ventures. He has directed both SRI's Process Economics Program (PEP) and Petrochemicals Supply Curve Program (S-CURVE). Walter's industry background includes more than 10 years with Shell Development Company and Air Products (UK) in process development and evaluation, process design, and plant startup. He was educated in the UK, receiving his undergraduate training in chemical engineering at Imperial College, London, and a PhD in chemical engineering at Pembroke College, Cambridge. In addition he studied business administration at the London School of Economics.
For more information: Walter Sedriks, Principal, Sedriks & Associates, 325 Waverley St., Palo Alto, CA 94301. Phone: 650-329-0554. Fax: 650-329-9653. Email: sedriks@earthlink.net.
Edited by Alan S. Brown
